How to Measure the Digital Impact of Your Campaigns
Written by Mate Tagaj
8 min read
Published on Oct 22, 2024
Updated on Jan 27, 2025
For most advocacy organisations in Europe, the EU elections were one of the most important events on the calendar. It was a great time to rally support and try to influence policies that get you closer to your goals. Thanks to social media and digital marketing, campaigning during elections has taken on a whole different level. But, how do you know the digital impact of your campaigns and whether they were actually effective?

After all, you’ve probably invested a lot of time & money into your campaign, so you’d hope it’s reaching your intended audience.
At Boostern, we specialise in helping purpose-driven organisations stand out by building memorable & impactful campaigns. In this guide, we’ll take you through how to monitor the success of your campaigns online.
Why Should You Use Digital Marketing to Track the Digital Impact of Your Advocacy Campaigns?
The digital impact that nonprofits can have thanks to digital marketing is astonishing. For instance, the EU elections presented a unique and untapped opportunity to reach change-makers via a suite of digital tools.
How to plan these campaigns is a whole other topic. However, with a strong strategy, you can reach a wider audience and move closer to your goals quickly.
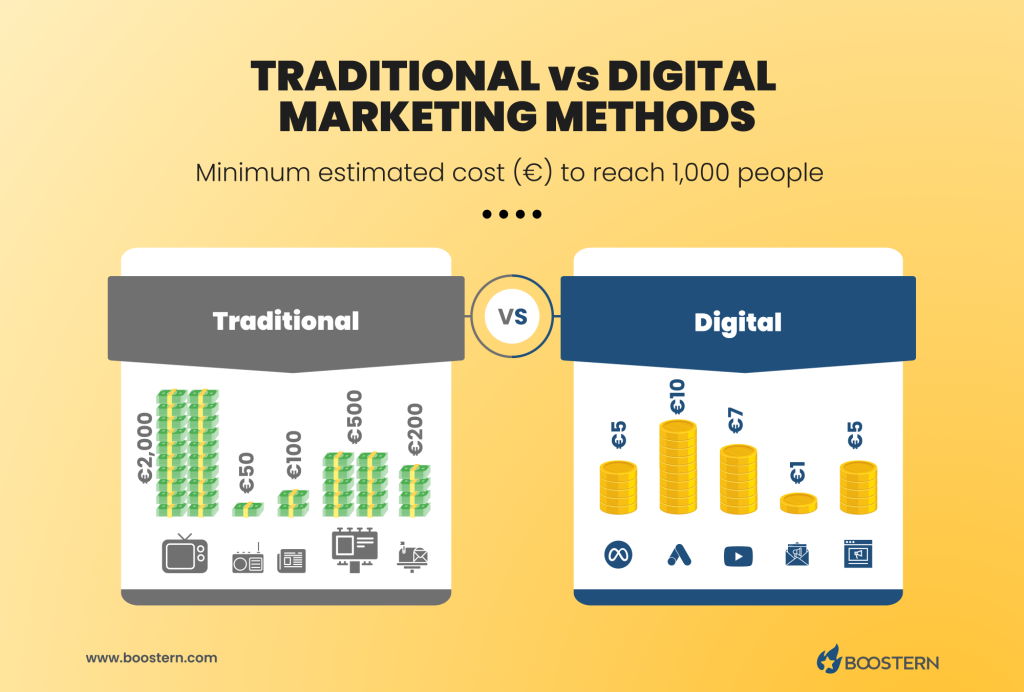
Ultimately, digital marketing provides a more cost-effective way to campaign when compared with traditional campaigning methods. Because of this, you can spread your budgets further while creating and sharing targeted messages to the people who might be interested in your cause.

How to Measure the Digital Impact Metrics of Your Social Media Campaign?
Engagement, interaction and building a community are the main focus of any social media campaign. But how do you know that your social media campaign is truly keeping people engaged?
What’s more, how do you know if it’s providing a return for the valuable resources you invested in your campaign? Below are key social media metrics and strategies to effectively gauge your social media campaign success.
Audience Growth and Awareness Metrics
- Follower growth: How many new followers have you gained over the course of your campaign? If there is a steady uptick in the number of followers you’re gaining, this is a great sign!
- Impressions and reach: How many times has your content been seen? How many unique users saw it? This will give you a good idea of the visibility of your content.
- Mentions: Keep track of how often people mention your organisation, or a campaign hashtag if you have one. This can be an indication of growing brand awareness.
Engagement Metrics
- Likes, comments and shares: the more likes, comments and shares your content receives, the better! It sounds like a no-brainer, but this might not be what you should be eventually looking for.
- Clicks: after seeing or interacting with your post, the next valuable step you want users to take is to click on links within them. The more clicks you get, the more likely it is to get users to take actions you want them to.
- CTR (Click-Through Rate): CTR shows you the percentage of people who clicked out of those who saw your post. A higher CTR means that you have a captivating copy that inspires people to take action. They are more likely to move forward in your designed process to ultimately take the action you desire.
Conversion Metrics
- Website Conversions: Impact measurement on your website can be done by tracking certain user actions like form submission, scroll depth or engagement time to see how your campaign affected the way people interacted with your site during the promotional period. If you are interested in learning more about the top metrics we recommend tracking within Google Analytics 4 (GA4), check out our Deep Dive into the GA4 Dashboard: Unlock Data-Driven Decisions article.
- Lead Generation: Track the leads generated thanks to your campaign. A lead is an individual who is interested in your campaign and is willing to share personal information with you. For instance, it can be their email address to learn more or to get involved. Some examples could include people signing up for your newsletter, downloading a report in exchange for an email address, or submitting a contact form to get in touch.
Beyond the Numbers
Metrics are important, of course. However, it’s also important to look qualitatively at what the comments, shares or mentions are actually saying about your campaign.
Are people leaving positive comments and joining your campaign? Or are they asking questions and raising problems with your campaign?
No amount of analytical tracking will give you this information, you’ll have to go through and look for yourself! This is a really important part of measuring impact during and after your campaign. It will help you to understand how people are really responding to your campaign.
How to Measure the Digital Impact Metrics of Your Campaigns Using Google Analytics

Although social media is becoming increasingly popular, you shouldn’t forget about some of the more traditional digital marketing tools. Channels like your website, landing pages, and newsletters should be also considered. A lot of your work in this aspect can be tracked through Google Analytics.
We’ve written plenty of guides on how to set up and use Google Analytics as a nonprofit. This is a good place to get started. We also offer Google Analytics courses that are specifically designed for nonprofits.
Google Analytics 4 (GA4) Training for Nonprofits
You can also access our recent GA4 training, which gives you a much more in-depth understanding of how the platform works. Book a meeting with us today to discuss a tailored GA4 training for your team.
Once you’re all set up and ready to go in Google Analytics, here’s how you can create an impact measurement plan for the digital impact metrics of your campaign.
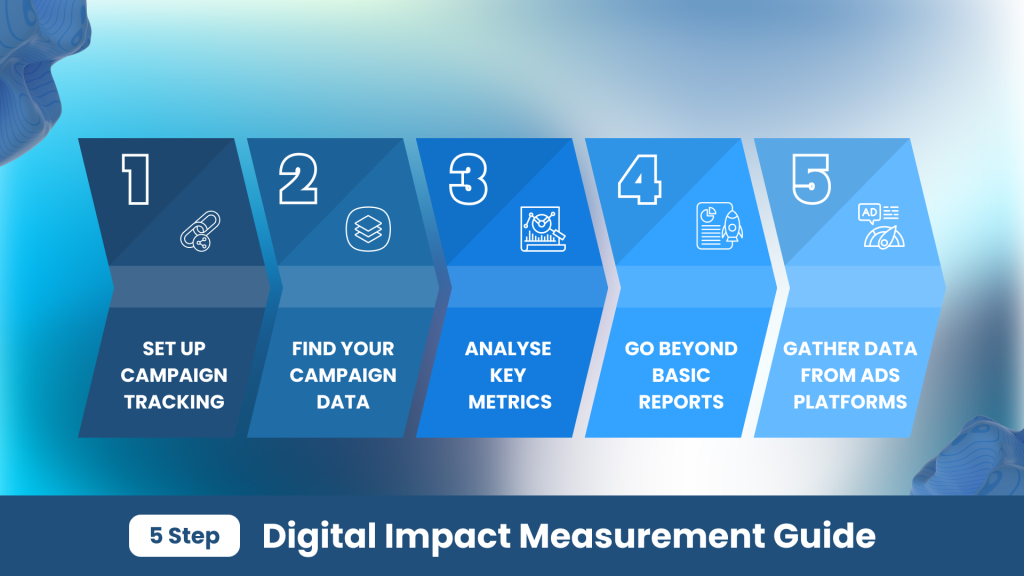
#1 Set Up Campaign Tracking
You can add UTM parameters to your URLs, which essentially tell Google Analytics where your traffic is coming from – whether that’s LinkedIn or your latest email newsletter.
It will also provide you with extra information on what medium it uses (eg a paid advertisement, or a social media post), as well as other aspects of your campaign. To learn more about creating UTM-powered URLs, check out our Deep Dive into the GA4 Dashboard: Unlock Data-Driven Decisions article where we explain what UTM is, how it works, what are the best free UTM-building tools and where you can find & analyse the collected data in your Google Analytics 4 Dashboard.
#2 Find Your Campaign Data
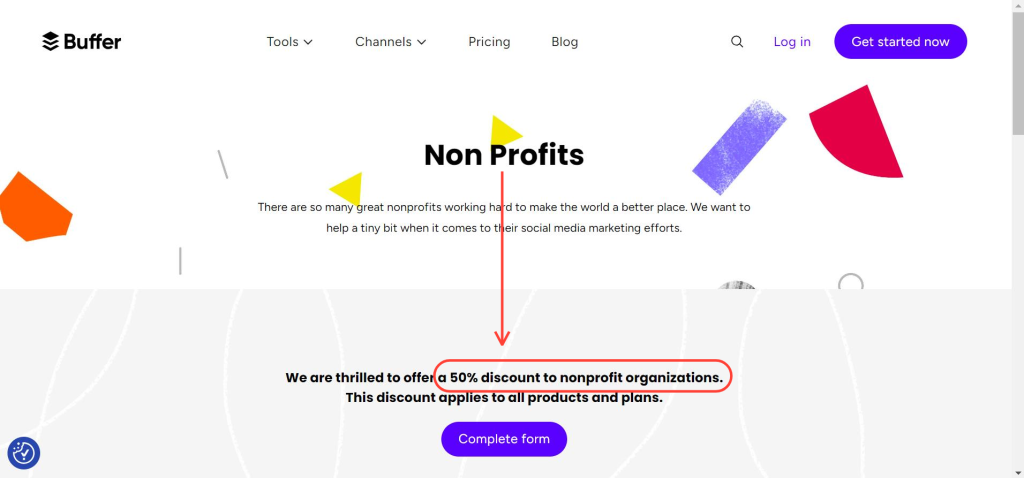
If you are using a social media automation tool like Buffer (which offers 50% lifetime discounts for nonprofits by the way), you can also easily add your scheduled posts to campaigns (tags). This will allow you to track the performance of your campaign-related posts all in one place instead of jumping from platform to platform to gather your data.

Additionally, If you want to find any of the information that Google is collecting on a specific campaign, you will need to look for the UTM data generated based on the UTM-powered links you used for your campaign.
You can find UTM data in the standard Reports under Acquisition reports. We specifically recommend taking a look at your User acquisition and Traffic acquisition reports and adjusting your primary and secondary dimensions.
If your primary dimension is “First user default channel grouping”, adding a secondary dimension of “First user campaign” with ‘+’ icon in the same column will allow you to easily identify your specific campaign and related metrics.
#3 Analyse Key Metrics
You can really go as deep as you want with your data analysis, but here are some of the key metrics we highly recommend tracking:
- Shares and Reposts (Social Media)
- Clicks (Social Media)
- CTR (Social Media)
- Follower Growth (Social Media)
- Mentions (Social Media)
- Users (GA4)
- New Users (GA4)
- Key Events (GA4)
However, it’s important to emphasise that you do not need to track all of these. Your impact measurement plan should only focus on 3-5 key metrics to follow based on the core objective of your campaign, so select wisely.
#4 Go Beyond the Basic Reports
If you feel confident with the basic reports that Google Analytics provides, you could also try some of the Explorations within GA4 to create custom reports within your account and analyse them using a drag-and-drop interface.
You could also set up custom Looker Studio dashboards to automate data collection and visualisation. This will help you immensely to visualise selected metrics across specific campaigns in one place and to overall automate your campaign reporting.
#5 Gather Data from Your Advertising Platforms
You might have dedicated some budget to paid online advertising on social media or Google. You may be already benefitting from the Google Ad Grants.
If you are boosting your campaign with some paid ads, you can then link your Google Ads account with your Google Analytics or plug in all your advertising data into a Looker Studio report for granular performance insights.
Get the Most Digital Impact Out of Your Campaign
We know that big campaigns like the one around the EU elections can be a stressful time and a lot of time and money goes into producing materials for the campaigns you’re putting out. This is why we want to make sure you’re getting the most out of your work and that you can ultimately track the digital impact of all your investments.
By properly measuring impact, you can easily check the performance of your campaign and quickly make adjustments if needed.
If you’d like to get help setting up tracking and levelling up your digital marketing game, get in touch with our team of experts at Boostern who are always ready to help.